Australia Rental Properties: Market Challenges & Insights
The market for Australia rental properties has become increasingly competitive, leaving many tenants struggling to secure homes. Last year, I lost some friends who left town traumatised by the crazy rental market.
A family with two incomes, one teenager, and community minded, involved in the local P&C, had a flawless rental history and excellent references.
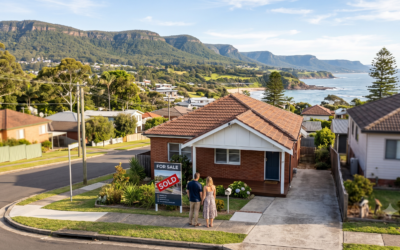
Like many beach homes on the South Coast of NSW, their landlord wanted the house back when the lease ended. Every time they looked for property to rent, they faced brick wall after brick wall. When a home finally listed, it was swamped with 30-40 applications every time.
Stress levels rose, and after months of effort—and help from our networks—they finally secured a rental through a friend of a friend. The ordeal was so upsetting that they decided to move interstate and buy a home, ending their rental struggles and paying a quarter of what they would have on the South Coast.
Understanding Vacancy Rates
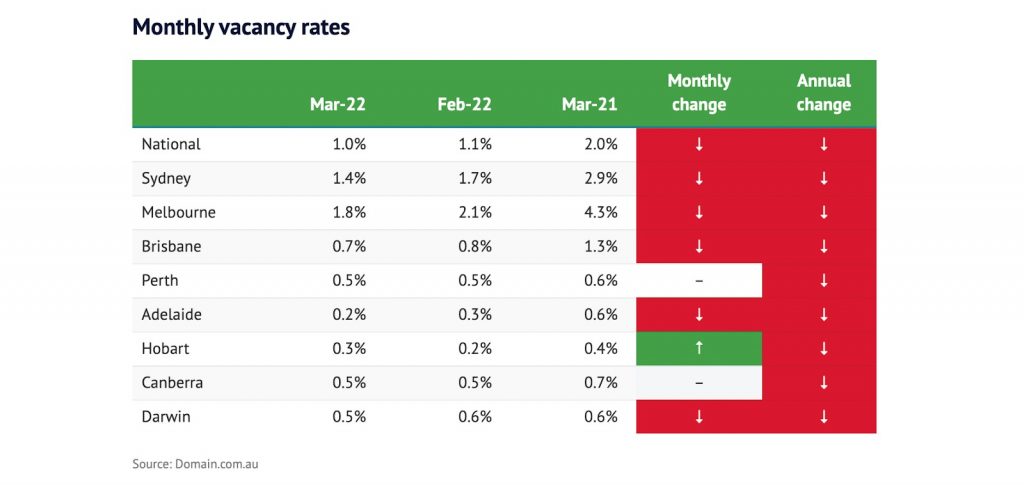
The most critical factor in Australia rental properties is vacancy rate. This metric measures the number of homes available for rent versus total rental stock. A normal rate sits between 2-3%. Low vacancy means fewer homes, higher competition, and rising rents. Nationwide, the vacancy rate is just 1.1%, half of pre-COVID levels and the lowest since 2006.
Urban vs Regional Rental Trends
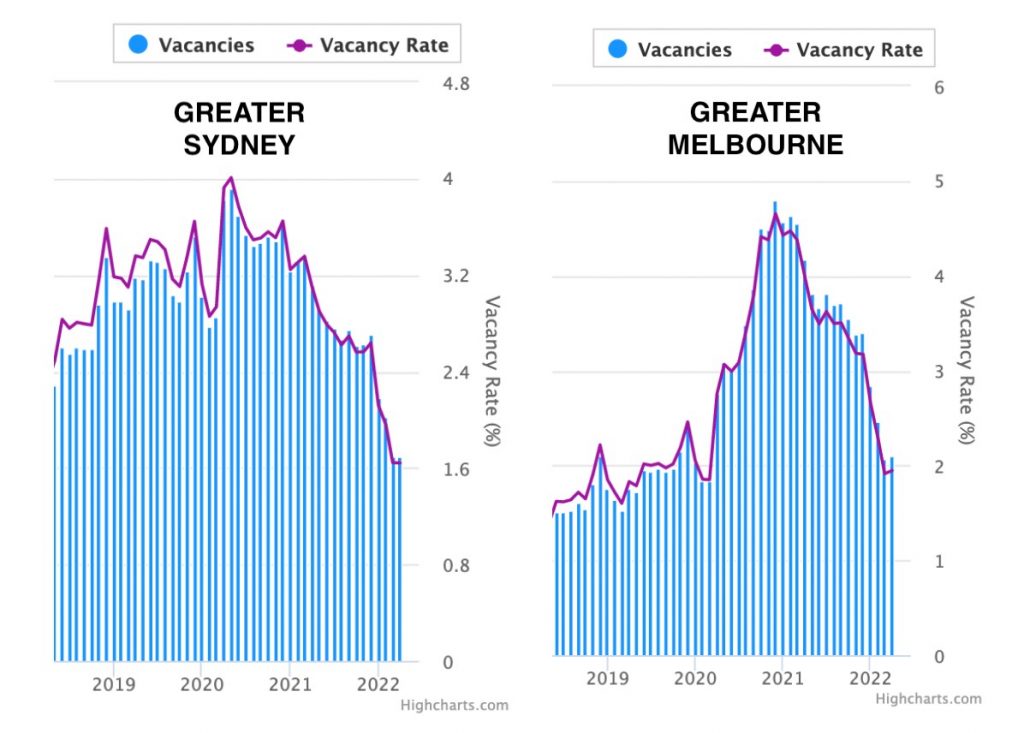
During COVID, Sydney and Melbourne saw temporary vacancy spikes. Sydney went from 2.9% to 4%, and Melbourne from 1.9% to 4.7%. Bernard Salt called these residents VESPAs—Virus Escapees Seeking Provincial Australia. Now, Sydney sits at 1.6% and Melbourne at 1.9%, returning close to historical norms.
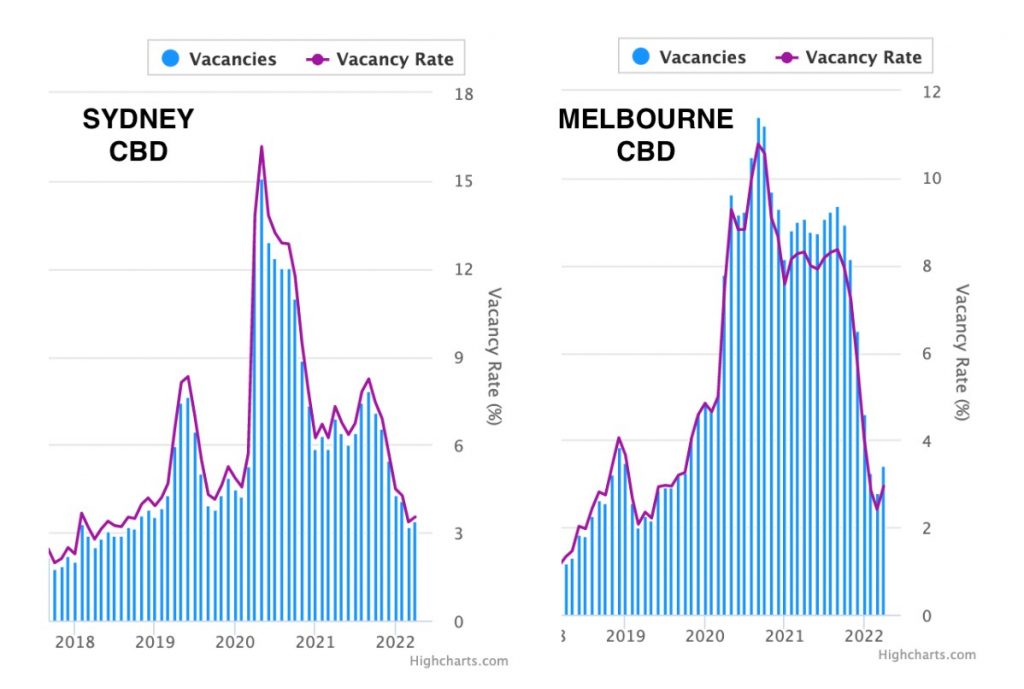
Inner city areas suffered most. Sydney CBD peaked at 16.4% vacancy, Melbourne 10.8%, while outer suburbs with family homes stayed relatively stable. Regional areas are even tighter, with vacancies often below 0.5%, making rentals extremely competitive.
Impact on Renters
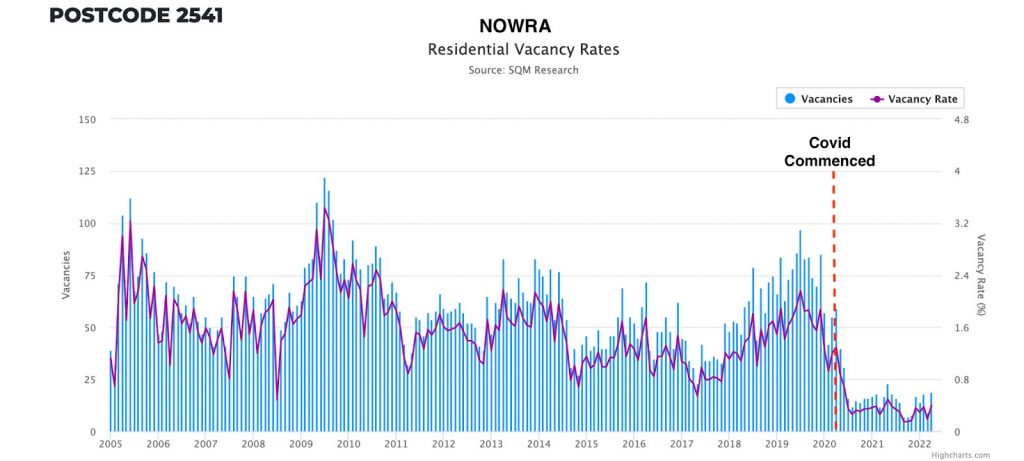
For tenants, ultra-low vacancy rates mean limited options. A suburb with 300 rental homes may only have 0-1 available at any given time. Families struggle to find 3-4 bedroom homes close to work or school. In NSW South Coast and regional towns, recent vacancy rates included:
- Bulli 0.0%
- Cooma 0.0%
- Jindabyne 0.1%
- Nowra 0.1%
- Warilla 0.1%
- Orange 0.1%
- Ulladulla 0.2%
- Moss Vale 0.2%
- Kiama 0.3%
- Wagga Wagga 0.3%
- Albury 0.3%
- Dubbo 0.4%
Future Outlook for Australia Rental Properties
Demand for more space, remote work flexibility, and lifestyle changes could permanently shift renters to regional areas. This shift requires more infrastructure and housing to meet growing demand. Rent prices are likely to continue rising, affecting both urban and regional Australia rental properties.
For property investors, the current market provides strong opportunities to improve cash flow and yields. For renters, paying rent on time and exploring buying options may be crucial for stability.
Explore more insights on our blog or check out video resources for tips on property investment and rentals.